


🔢 What is the Fibonacci Retracement?
Fibonacci Retracement is a leading technical analysis tool used to identify potential price reversal levels across markets such as stocks and Forex.
A Historic Analysis of Fibonacci Retracement
This tool is based on a sequence of numbers discovered by the Italian mathematician Leonardo Fibonacci in the 13th century AD. These numbers have significance far beyond trading. The ratio 1.618 appears throughout the universe and nature. The ancient Greeks widely used this ratio in their architecture—the famous Parthenon was built using 1.618. The architect of the Parthenon, Phidias (5th century BC), is why 1.618 is also known as the Phi Number:
Phi Number (φ) = 1.61803398875... also called the ‘Golden Ratio’.
🔗 Book: » The book for Fibonacci Trading at Amazon Books
🔗 More: » More about Fibonacci Trading at TradingFibonacci.com
The Fibonacci Sequence of Numbers
The Fibonacci sequence is based on the principle that each number is the sum of the two preceding numbers, and this pattern continues infinitely. Here are the first numbers of the sequence:
📝 0, 1, 1, 2, 3, 5, 8, 13, 21, 34, 55, 89, 144, 233, 377, 610, 987, 1597, 2584, etc.
Here are some interesting facts about the Fibonacci sequence:
◘ Every number in the sequence is the sum of the two preceding numbers.
◘ Dividing any number by the previous number approximates 1.618.
◘ Dividing any number by the next number approximates 0.618.
◘ Dividing any number by the number two places higher approximates 0.382.
◘ Dividing any number by the number three places higher approximates 0.236.

The Fibonacci Retracement
Based on the above sequence, several important ratios are derived:
1) The 23.6% Ratio
2) The 38.2% Ratio
3) The 61.8% Ratio {It is called the ‘Golden Ratio"}
Additionally, some technicians use two more ratios:
4) The 50% Ratio
5) The 78.6% Ratio
Chart: The Fibonacci Retracement in Action
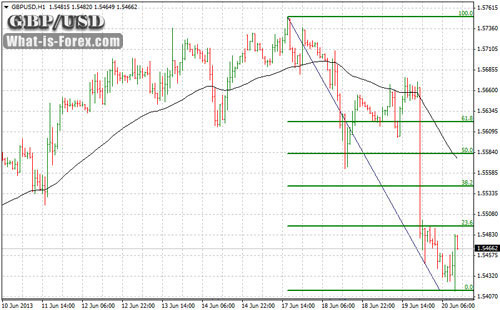
Important Note
Fibonacci retracement levels should be viewed as alert zones for potential trend reversals, not as exact support or resistance levels. It is not advisable to place a stop-loss precisely above or below a Fibonacci level before the price has reached and tested that level. Only after the price tests a Fibonacci level should you execute the trade and set a stop-loss above or below the recent local low or high. Since the market is uncertain, trying to buy at the absolute bottom or sell at the highest point of a move is risky. It’s better to wait until the market confirms itself before entering a trade.
Price Alerts Using Fibonacci Retracement
Fibonacci retracement levels generate alerts about potential resistance or support areas and possible trend reversals. When a pullback begins (point B on the chart), the Fibonacci retracement levels—especially 23.6%, 38.2%, and 61.8%—can be closely monitored. More about Fibonacci retracement at TradingFibonacci.com.
🔗 Compare: » Forex Brokers List | » Forex Bonus
🔗 Recommended eBook: » Trading World Markets Using Phi and the Fibonacci Numbers: Reference to Elliott Waves, Gann Numbers, and Harmonic Patterns
🔗 Read More: » What is Stochastic Oscillator | » What is Williams %R | » What is Pivot Point | » What is RSI | » What is MACD | » What are Round Numbers?
◘ What-is-Forex.com (c)
What is Fibonacci Retracement?
