📉 What is Williams %R?
Williams %R (or %R) is a momentum oscillator developed by Larry Williams in 1973. It is used in technical analysis to identify overbought and oversold market conditions and can also generate potential buy and sell signals.
Williams %R Default Settings & Explanation
Williams %R is similar to the Stochastic Oscillator but with an inverted scale, ranging from -100% to 0%. While Williams %R measures the close relative to the highest high over a given period, the Stochastic Oscillator measures the close relative to the lowest low.
- The default setting for Williams %R is 14 periods.
Williams %R Price Range & Explanation
Williams %R values range from 0% to -100%:
◘ Values between 0% and -20% indicate overbought conditions.
- A reading of 0% means the last close is equal to the highest price in the period.
◘ A value around -50% suggests that a new trend may be forming.
◘ Values between -80% and -100% indicate oversold conditions.
- A reading of -100% means the last close is equal to the lowest price in the period.
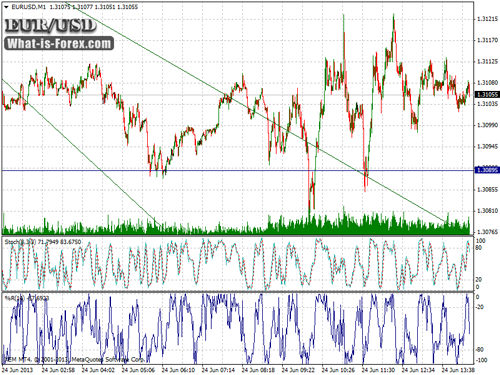
In the following chart, you can observe the Williams %R (14 periods) on EUR/USD compared to the Stochastic Oscillator.
Chart: Williams %R & Stochastic

Williams %R Trading Signals
-
When Williams %R reaches -100%, it indicates oversold conditions, but this alone is not a buy signal.
A buy signal occurs when %R first touches -100%, and then—after several closing periods—rises above -95% or even -85%.
-
When Williams %R reaches 0%, it indicates overbought conditions, but this alone is not a sell signal.
A sell signal occurs when %R first reaches 0%, and then—after several closing periods—falls below -5% or even -15%.
Williams %R Calculation
The Williams %R formula is similar to that of the Stochastic Oscillator:
■ Williams %R = [(High of the period – Close) / (High of the period – Low of the period)] × 100
Williams %R Confirmation
Williams %R signals are typically confirmed through volume activity and key support or resistance breakouts.
🔗 COMPARE: » Forex Brokers List | » Forex Bonus
🔗 Read More: » What is Stochastic Oscillator | » What is Pivot Point | » What is RSI | » What is MACD | » What are Round Numbers? | » What is the Fibonacci Retracement | » Technical Analysis Map
◘ What is Williams %R?
What-is-Forex.com (c)


