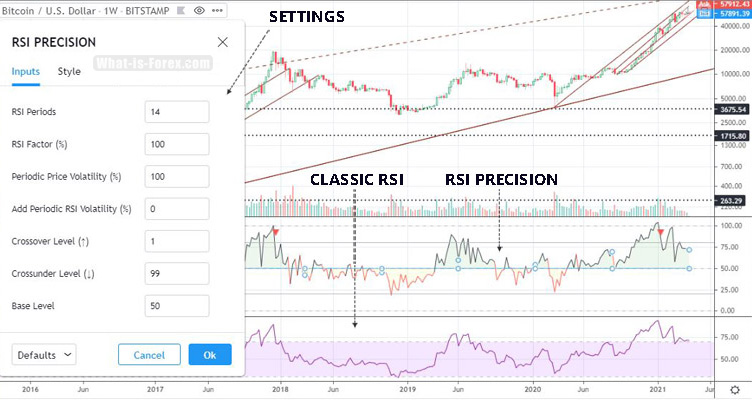
⚙️ What is the RSI Precision?
The classic Relative Strength Index (RSI) is one of the most widely used technical analysis indicators worldwide. It is an oscillator that identifies overbought and oversold conditions in any market. RSI PRECISION is an advanced version of the classic RSI, created by George Protonotarios. This technical analysis oscillator detects market tops and bottoms across any timeframe. It is easy to use and enhances traditional RSI readings by incorporating periodic market momentum and price volatility.
◙ Developer: George Protonotarios
◙ Usage: Shows Overbought/Oversold Market Levels
◙ Trading: Any financial market, very useful for highly volatile markets such as Bitcoin and other crypto markets
◙ Standard Settings: 14 Periods or 21 Periods
🔗 Add RSI PRECISION 3.0 on TradingView (for free): https://www.tradingview.com/script/cTEWnHdU-RSI-PRECISION-v-3
ℹ️ Technical Information About the Indicator
RSI PRECISION Can Help traders to:
(i) To make RSI readings more accurate, especially as concerns on large timeframes
(ii) Show overbought/oversold market conditions
(iii) Show market momentum
(iv) Identify tops/bottoms with accuracy
Market Conditions for RSI PRECISION
■ RSI 80+ Overbought (can go higher than 100)
■ RSI 20- Oversold (can go lower than 0)
Calculating RSI PRECISION?
The RSI PRECISION algorithm combines three components:
(i) RSI component
(ii) Price Volatility component
(iii) RSI Volatility component
🛠 Basic Settings
(i) RSI PERIODS
You can use RSI PRECISION on any period, however, it is recommended to use it on a 14-period or a 21-period timeframe.
(ii) RSI FACTOR
You can modify the classic RSI weight in the formula.
(iii) PERIODIC PRICE VOLATILITY
You can modify the market momentum/volatility weight in the formula.
(iv) PERIODIC RSI VOLATILITY (%)
You can add an extra calculation of RSI volatility.
(v) CROSSOVER LEVELS
You can add visual alerts (green/red arrows) on any financial asset, in any timeframe.
(vi) BASE LEVEL
The BASE LEVEL is the default value of market equilibrium. Below this level, readings are colored in red. Above this level, readings are colored in black.
📊 Why using RSI PRECISION?
RSI PRECISION is superior to the classic RSI because it is much more user-friendly and accurate. Especially on larger timeframes and in highly volatile markets, RSI PRECISION is the ideal tool for identifying overbought and oversold market levels.
👉 In the following chart, RSI PRECISION on Bitcoin/USD shows price action more accurately than the classic RSI.
Chart: RSI PRECISION on Bitcoin/USD

🔗 Add RSI PRECISION 3.0 on TradingView for free: https://www.tradingview.com/script/cTEWnHdU-RSI-PRECISION-v-3
🔗 COMPARE: » Forex Brokers List
🔗 Read More: » What is Stochastic Oscillator | » What is Williams %R | » What is Pivot Point | » What is MACD | » What are Round Numbers? | » What is Fibonacci Retracement | » Technical Analysis Map
◘ What is RSI Precision?
What-is-Forex.com


